
告警Alertmanger
上面设置了规则,也可以正常告警,但并不会将告警主动推送给用户。要想主动推送给用户可以配置将告警信息推送至Alertmanger。
创建配置文件:
vim prometheus-alertmanager-config.yml
apiVersion: v1
kind: ConfigMap
metadata:
  name: alertmanager-config
  namespace: monitoring
  labels:
    app: prometheus-alertmanager
data:
  alertmanager.yml: |
    global:
      resolve_timeout: 5m
      smtp_smarthost: 'mail.xxx.com:465'
      smtp_from: 'Prometheus<[email protected]>'
      smtp_auth_username: '[email protected]'
      smtp_auth_password: 'YourPass'
      smtp_require_tls: false
    templates:
      - /etc/config/template/*.tmpl
    route:
      group_by: ['alertname']   # 报警分组依据
      group_wait: 30s   # 进行分组,等待时间后发送警报
      group_interval: 5m   # 同一Alert Group告警,等待间隔后再发送新警报
      repeat_interval: 30m  # Alert Group警报没变化且发送成功,重发警报的周期
      receiver: 'email'  # 发送警报的接收者的名称,以下receivers name的名称
    receivers:
      - name: 'email'
        email_configs:
        - to: 'Chris<[email protected]>'
          html: '{{ template "email.html" . }}'
          headers: { Subject: "[Prometheus] 报警邮件"}
          send_resolved: true
    inhibit_rules:
      - source_match:
          level: 'Critical'
        target_match:
          level: 'Warning'
        equal: ['alertname', 'dev', 'instance']
kubectl create -f prometheus-alertmanager-config.yml
kubectl -n monitoring get configmaps
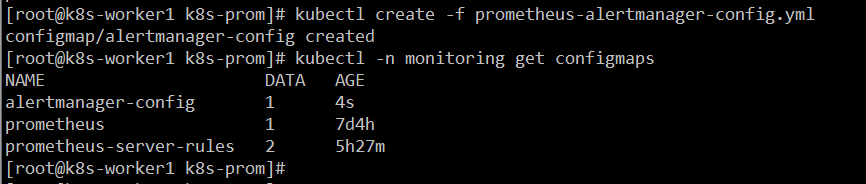
Tips:alertname就是在上面告警规则中rules – alert 中定义的规则名称。
创建告警模板:
vim prometheus-alertmanager-tmpl.yml
apiVersion: v1
kind: ConfigMap
metadata:
  name: alertmanager-tmpl
  namespace: monitoring
  labels:
    app: prometheus-alertmanager
data:
  email.tmpl: |
    {{ define "email.html" }}
    <html><head>
      <link rel="shortcut icon" href="data:image/ico;base64,aWNv">
      <meta content="text/html; charset=utf-8">
    </head>
    <body style="font-family:msyh,Verdana,sans-serif;">
    <table style="width:95%"; class="gridtable"; border="1">

    {{ if gt (len .Alerts.Firing) 0 -}}
      <tr bgcolor="#99ccff"; style="color:red"><th colspan=6>Alerts Status Report.</th></tr>
      <tr>
        <th bgcolor="#99ccff">>告警类型</th>
        <th bgcolor="#99ccff">>实例</th>
        <th bgcolor="#99ccff">>当前值</th>
        <th bgcolor="#99ccff">>告警级别</th>
        <th bgcolor="#99ccff">>开始时间</th>
        <th bgcolor="#99ccff">>告警摘要</th>
      </tr>
    {{- end }}
    {{ range .Alerts.Firing }}
      <tr>
        <td>{{ index .Labels "alertname" }}</td>
        <td>{{ index .Labels "instance" }}</td>
        <td>{{ index .Annotations "value" }}</td>
        <td>{{ index .Labels "level" }}</td>
        <td>{{ .StartsAt.Format "2006-01-02 15:04:05 MST" }}</td>
        <td>{{ index .Annotations "summary" }}</td>
      </tr>
    {{ end }}

    {{ if gt (len .Alerts.Resolved) 0 -}}
      <tr bgcolor="#99ccff"; style="color:green"><th colspan=7>Resolved Status Report.</th></tr>
      <tr>
        <th bgcolor="#99ccff">>告警类型</th>
        <th bgcolor="#99ccff">>实例</th>
        <th bgcolor="#99ccff">>当前值</th>
        <th bgcolor="#99ccff">>告警级别</th>
        <th bgcolor="#99ccff">>开始时间</th>
        <th bgcolor="#99ccff">>恢复时间</th>
        <th bgcolor="#99ccff">>告警摘要</th>
      </tr>
    {{- end }}
    {{ range .Alerts.Resolved }}
      <tr>
        <td>{{ index .Labels "alertname" }}</td>
        <td>{{ index .Labels "instance" }}</td>
        <td>{{ index .Annotations "value" }}</td>
        <td>{{ index .Labels "level" }}</td>
        <td>{{ .StartsAt.Format "2006-01-02 15:04:05 MST" }}</td>
        <td>{{ .EndsAt.Format "2006-01-02 15:04:05 MST" }}</td>
        <td>{{ index .Annotations "summary" }}</td>
      </tr>
    {{ end }}
    </table>
    </body>
    {{ end }}
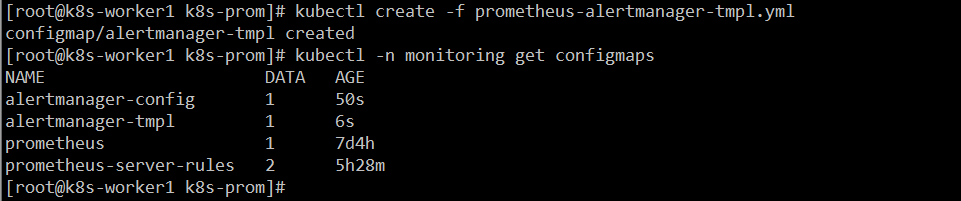
kubectl create -f prometheus-alertmanager-tmpl.yml
kubectl -n monitoring get configmaps
部署AlertMananger
用Deployment的就可以了,当然也可以用StatefulSet来存放信息:
vim prometheus-alertmanager.yml
apiVersion: apps/v1
kind: Deployment
metadata:
  name: alertmanager
  namespace: monitoring
  labels:
    app: prometheus
    component: alertmanager
    release: v0.21.0
spec:
  replicas: 1
  selector:
    matchLabels:
      app: prometheus
      component: alertmanager
  template:
    metadata:
      labels:
        app: prometheus
        component: alertmanager
        release: v0.21.0
    spec:
      priorityClassName: system-cluster-critical
      containers:
        - name: prometheus-alertmanager
          image: "prom/alertmanager:v0.21.0"
          imagePullPolicy: "IfNotPresent"
          args:
            - --config.file=/etc/config/alertmanager.yml
            - --storage.path=/data
          ports:
            - containerPort: 9093
          readinessProbe:
            httpGet:
              path: /-/ready
              port: 9093
            initialDelaySeconds: 30
            timeoutSeconds: 30
          volumeMounts:
            - name: config-volume
              mountPath: /etc/config
            - name: tmpl-volume
              mountPath: /etc/config/template
            - name: data-volume
              mountPath: /data
          resources:
            limits:
              cpu: 10m
              memory: 50Mi
            requests:
              cpu: 10m
              memory: 50Mi
      volumes:
        - name: config-volume
          configMap:
            name: alertmanager-config
        - name: tmpl-volume
          configMap:
            name: alertmanager-tmpl
        - name: data-volume
          emptyDir: {}
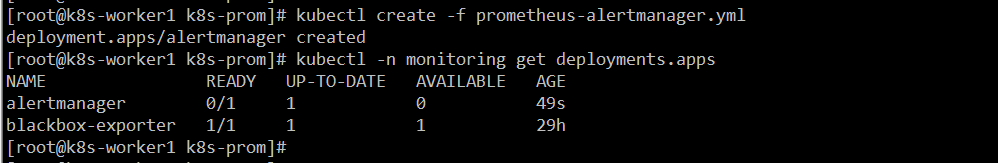
kubectl create -f prometheus-alertmanager.yml
kubectl -n monitoring get deployments.apps
也可查看挂载:
kubectl -n monitoring exec -it alertmanager-786cfb86c4-jntn7 -- ls /etc/config/
kubectl -n monitoring exec -it alertmanager-786cfb86c4-jntn7 -- ls /etc/config/template

创建服务:
vim prometheus-alertmanager-svc.yml
kind: Service
apiVersion: v1
metadata:
  name: alertmanager
  namespace: monitoring
  labels:
    app: prometheus
    component: alertmanager
spec:
  ports:
    - name: http
      protocol: TCP
      port: 80
      targetPort: 9093
      nodePort: 30093
  selector:
    app: prometheus
    component: alertmanager
  type: NodePort
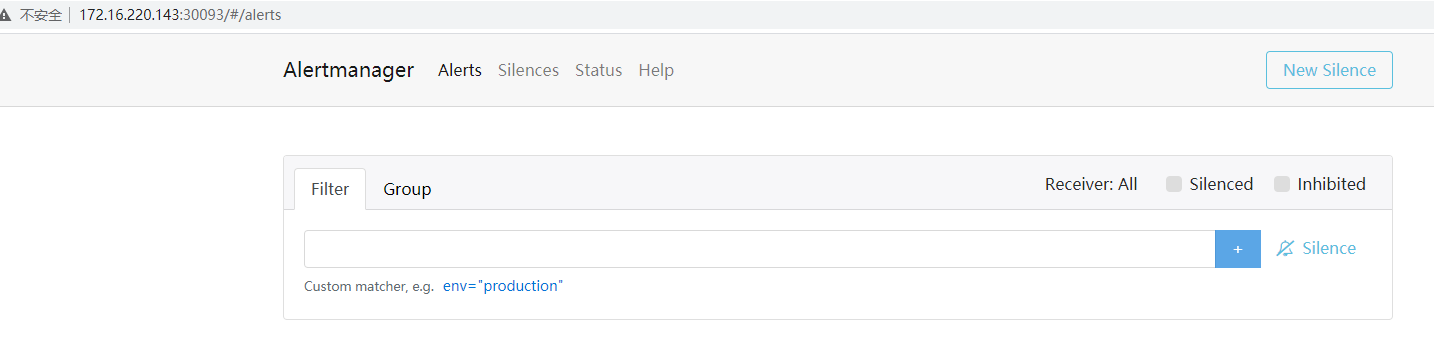
kubectl create -f prometheus-alertmanager-svc.yml
kubectl -n monitoring get svc
通过节点IP:30093即可访问到其:
修改Prometheus配置,使其在触发告警后可将信息传递给Alertmanger。
vim prometheus-config.yml
...
    alerting:
      alertmanagers:
      - static_configs:
        - targets:
          - alertmanager:80
      alert_relabel_configs:
      - source_labels: [kubernetes_pod]
        action: replace
        target_label: pod
        regex: (.+)
      - source_labels: [pod_name]
        action: replace
        target_label: pod
        regex: (.+)
...
kubectl replace -f prometheus-config.yml
curl -X POST http://172.16.220.143:3009{0,3}/-/reload
It is a pity, that now I can not express – it is very occupied. I will return – I will necessarily express the opinion on this question.