
前二篇文章讲了Prometheus在K8S群集中的部署和监控配置;接下来就是需要创建Prometheus的告警配置,并且在Prometheus配置文件中声明式的加载。
记录规则Record Rules
Prometheus 支持两种类型的 Rules ;可以对其进行配置,然后定期进行运算:recording rules 记录规则 与 alerting rules 警报规则,规则文件的计算频率与告警规则计算频率一致,都是通过全局配置中的 evaluation_interval 定义。
recording rules 是提前设置好一个比较花费大量时间运算或经常运算的表达式,其结果保存成一组新的时间序列数据。当需要查询的时候直接会返回已经计算好的结果,这样会比直接查询快,同时也减轻了PromQl的计算压力,同时对可视化查询的时候也很有用,可视化展示每次只需要刷新重复查询相同的表达式即可。
在配置的时候,除却 record: <string> 需要注意,其他的基本上是一样的,一个 groups 下可以包含多条规则 rules ,Recording 和 Rules 保存在 group 内,Group 中的规则以规则的配置时间间隔顺序运算,也就是全局中的 evaluation_interval 设置。
同样,可以将规则配置存放于configmap中:
vim prometheus-server-rules.yml
apiVersion: v1
kind: ConfigMap
metadata:
  name: prometheus-server-rules
  namespace: monitoring
  labels:
    app: prometheus
data:
  record-rule-pod-count.yaml: |
    groups:
      - name: pod-count-normal
        rules:
          - record: pod_count_normal_export
            expr: sum(kube_pod_status_phase{phase=~"Running|Succeeded"})by(namespace,cluster)
      - name: pod-count-abnormal
        rules:
          - record: pod_count_abnormal_export
            expr: sum(kube_pod_status_phase{phase!~"Running|Succeeded"})by(namespace,cluster)
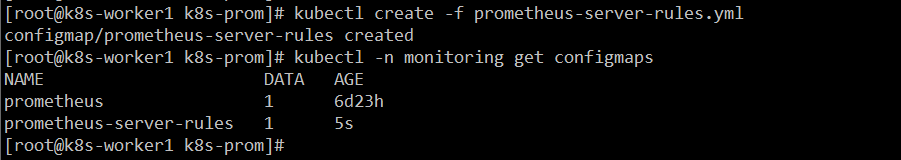
kubectl create -f prometheus-server-rules.yml
kubectl -n monitoring get configmaps
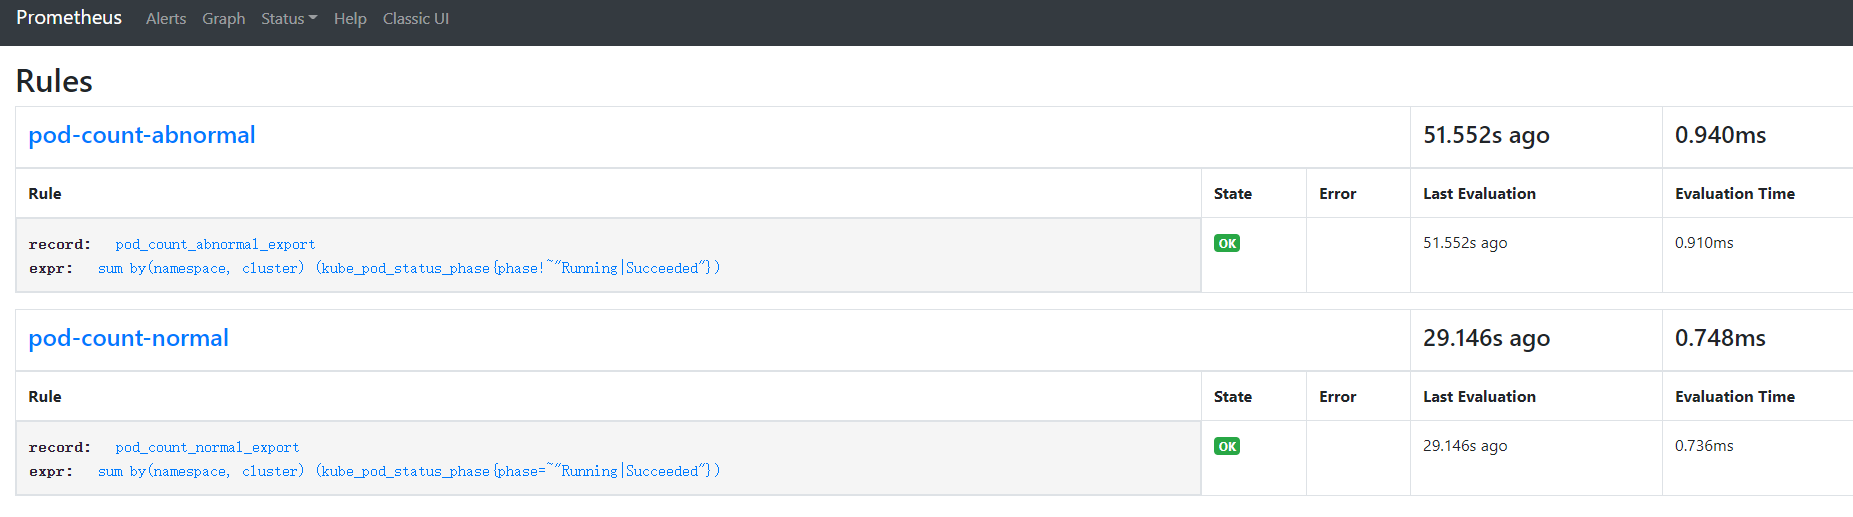
此规则是判断pod的运行状态并计算相关数量存入新建的记录值(record)中。
修改部署Prometheus的YAML文件并应用,使其能够加载到Rules的配置文件:
vim prometheus.yml
kind: StatefulSet
apiVersion: apps/v1
metadata:
  name: prometheus
  namespace: monitoring
  labels:
    app: prometheus
    component: server
    release: v2.26.0
spec:
  replicas: 1
  selector:
    matchLabels:
      app: prometheus
      component: server
  template:
    metadata:
      labels:
        app: prometheus
        component: server
        release: v2.26.0
    spec:
      volumes:
        - name: localtime
          hostPath:
            path: /etc/localtime
            type: ''
        - name: config-volume
          configMap:
            name: prometheus
            items:
              - key: prometheus.yml
                path: prometheus.yml
            defaultMode: 420
        - name: prometheus-rules
          configMap:
            name: prometheus-server-rules
            defaultMode: 420
      containers:
        - name: prometheus-server
          image: 'prom/prometheus:v2.26.0'
          command:
            - /bin/sh
            - '-c'
            - 'prometheus --storage.tsdb.retention=30d --config.file=/etc/config/prometheus.yml --storage.tsdb.path=/data/${HOSTNAME} --web.enable-lifecycle'
          ports:
            - containerPort: 9090
              protocol: TCP
          resources:
            limits:
              cpu: '2'
              memory: 8Gi
            requests:
              cpu: 500m
              memory: 2Gi
          volumeMounts:
            - name: localtime
              readOnly: true
              mountPath: /etc/localtime
            - name: config-volume
              mountPath: /etc/config
            - name: pvc
              mountPath: /data
            - name: prometheus-rules
              mountPath: /etc/prometheus/rules
          livenessProbe:
            httpGet:
              path: /-/healthy
              port: 9090
              scheme: HTTP
            initialDelaySeconds: 30
            timeoutSeconds: 30
            periodSeconds: 10
            successThreshold: 1
            failureThreshold: 3
          readinessProbe:
            httpGet:
              path: /-/ready
              port: 9090
              scheme: HTTP
            initialDelaySeconds: 30
            timeoutSeconds: 30
            periodSeconds: 10
            successThreshold: 1
            failureThreshold: 3
          imagePullPolicy: IfNotPresent
          securityContext:
            readOnlyRootFilesystem: true
            allowPrivilegeEscalation: false
      restartPolicy: Always
      serviceAccountName: prometheus
      serviceAccount: prometheus
  volumeClaimTemplates:
    - kind: PersistentVolumeClaim
      apiVersion: v1
      metadata:
        name: pvc
      spec:
        accessModes:
          - ReadWriteOnce
        resources:
          requests:
            storage: 10Gi
        storageClassName: managed-nfs-storage
  serviceName: prometheus-headless
kubectl replace -f prometheus.yml

通过下面命令即可看到Pod已将configmap挂载。
kubectl -n monitoring exec -it prometheus-0 -- ls /etc/prometheus/rules/

同时还需要修改Prometheus配置文件,增加读取规则信息:
vim prometheus-config.yml
...
    rule_files:
      - /etc/prometheus/rules/*.yaml
...
kubectl replace -f prometheus-config.yml
curl -X POST http://172.16.220.143:30090/-/reload
重新加载后,即可看到添加的规则信息:
It is a pity, that now I can not express – it is very occupied. I will return – I will necessarily express the opinion on this question.